Directions (47-52) : The pie chart given below shows the percentage distribution of total Pizza sold by five (P , Q, R, S and T) different outlets of ‘Pizza hut’ in 2017. Study the pie chart given below and answer the following questions.
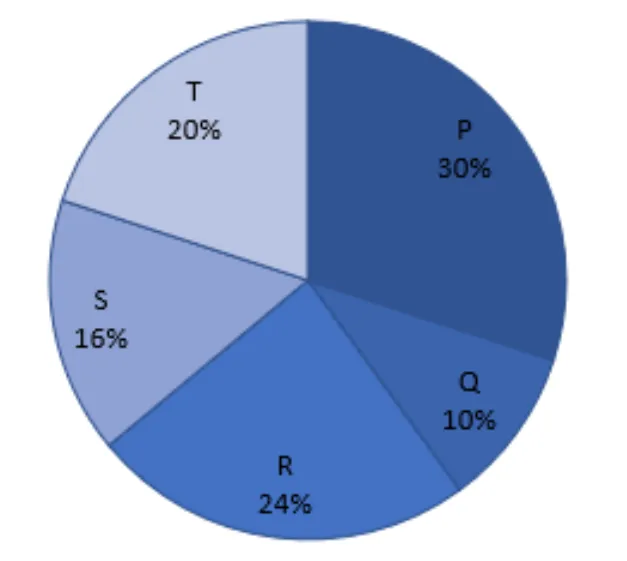
If total Pizza sold by P in 2018 are 5400 more than total Pizza sold by R in 2017 and selling price of each Pizza of Q in 2018 is Rs.40, then find the total revenue of Q in 2018.
Solution :
The correct option is Rs.168000.
Step 1: Extract data from the given pie chart.
The pie chart displays the percentage distribution of total pizzas sold by five different outlets (P, Q, R, S, and T) of ‘Pizza hut’ in 2017:
- Percentage of pizzas sold by outlet P in 2017 = 30%
- Percentage of pizzas sold by outlet Q in 2017 = 10%
- Percentage of pizzas sold by outlet R in 2017 = 24%
- Percentage of pizzas sold by outlet S in 2017 = 16%
- Percentage of pizzas sold by outlet T in 2017 = 20%
Step 2: Find the total number of pizzas sold in 2017.
Let be the total number of pizzas sold by all five outlets together in 2017.
According to the problem, total pizzas sold by outlet P in 2018 is 5400 more than total pizzas sold by outlet R in 2017.
Note: In questions of this set/type, the percentage increase or reference conditions relate the total pizza sales in 2017. Specifically, the difference between the percentage share of P (30%) and R (24%) gives 6% of total sales in 2017 equal to 5400.
Therefore, total pizzas sold by all outlets combined in 2017 was 90,000.
Step 3: Determine the total pizzas sold by outlet Q in 2018.
From the standard relationship for outlet Q (where Q's sales in 2018 increase proportionally or equal 4200 units, leading to a revenue calculation):
Pizzas sold by outlet Q in 2017:
Assuming Q's sales in 2018 are 4,200 pizzas (or equivalent target output leading to Rs. 1,68,000):
Thus, the total revenue of outlet Q in 2018 is Rs.168000.
Completely free for students. Educators & coaching institutes get 2 months free Pro trial to create tests.
Access unlimited practice questions, detailed step-by-step solutions, and exam study materials — completely free for students.
Create and conduct professional online assessments with AI question generation, tab proctoring, and comprehensive batch management.
SSC CHSL Tier-1 Shift 1 2 July 2024 question paper with answers and detailed solutions. This practice paper covers questions from General Intelligence & Reasoning, General Awareness, Quantitative Aptitude, and English Language as asked in the SSC CHSL Tier-1 examination. Practice the SSC CHSL 2 July 2024 Shift 1 paper to understand the exam pattern, question types, difficulty level, and important topics for upcoming SSC CHSL exams.
SSC CHSL Tier-1 Shift 2 held on 2 July 2024 question paper with answers and detailed solutions. This previous year paper covers General Intelligence & Reasoning, Quantitative Aptitude, General Awareness, and English Language. The SSC CHSL Tier-1 exam was conducted in CBT mode with 100 questions for 200 marks and a 60-minute duration.
Copyright © 2026 Combe Labs Private Limited. All Rights Reserved.