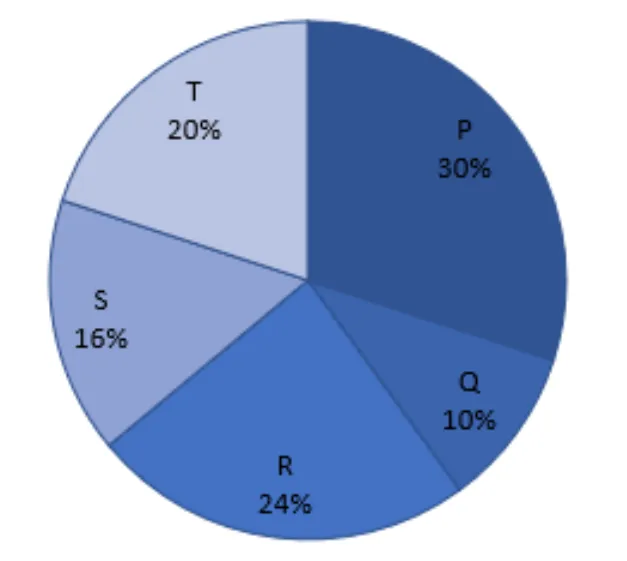
Directions (47-52) : The pie chart given below shows the percentage distribution of total Pizza sold by five (P , Q, R, S and T) different outlets of ‘Pizza hut’ in 2017. Study the pie chart given below and answer the following questions.
Note: I- Total Pizza sold by these five outlets in 2018 is 40% more than total Pizza sold by these five outlets in 2017.
II -Percentage distribution of total Pizza sold by these five outlets in 2018 is same as that of in 2017.
Total Pizza sold by S and T together in 2018 are what percent (Approx.) more or less than total Pizza sold by Q and R together in 2017?
Solution :
Correct Answer: 48% (Approx. 48%)
Step-by-step explanation:
From the given pie chart, the percentage distribution of total pizza sold by five outlets (P, Q, R, S, and T) in the year 2017 is as follows:
• Outlet P = 30%
• Outlet Q = 10%
• Outlet R = 24%
• Outlet S = 16%
• Outlet T = 20%
Let the total number of pizzas sold by all five outlets together in 2017 be .
Step 1: Calculate total pizzas sold by Q and R together in 2017.
Percentage of pizzas sold by Q in 2017 = 10%
Percentage of pizzas sold by R in 2017 = 24%
Combined percentage for Q and R in 2017 =
Total pizzas sold by Q and R in 2017 =
Step 2: Calculate total pizzas sold by S and T together in 2018.
According to Note I, total pizzas sold by all five outlets in 2018 is 40% more than in 2017:
According to Note II, the percentage distribution of pizzas sold by each outlet in 2018 remains the same as in 2017.
Percentage of pizzas sold by S in 2017 = 16%
Percentage of pizzas sold by T in 2017 = 20%
Combined percentage for S and T =
Total pizzas sold by S and T in 2018 =
Step 3: Calculate the required percentage increase/difference.
Difference between total pizzas sold by S and T in 2018 and total pizzas sold by Q and R in 2017:
Percentage more:
Completely free for students. Educators & coaching institutes get 2 months free Pro trial to create tests.
Access unlimited practice questions, detailed step-by-step solutions, and exam study materials — completely free for students.
Create and conduct professional online assessments with AI question generation, tab proctoring, and comprehensive batch management.
SSC CHSL Tier-1 Shift 1 2 July 2024 question paper with answers and detailed solutions. This practice paper covers questions from General Intelligence & Reasoning, General Awareness, Quantitative Aptitude, and English Language as asked in the SSC CHSL Tier-1 examination. Practice the SSC CHSL 2 July 2024 Shift 1 paper to understand the exam pattern, question types, difficulty level, and important topics for upcoming SSC CHSL exams.
SSC CHSL Tier-1 Shift 2 held on 2 July 2024 question paper with answers and detailed solutions. This previous year paper covers General Intelligence & Reasoning, Quantitative Aptitude, General Awareness, and English Language. The SSC CHSL Tier-1 exam was conducted in CBT mode with 100 questions for 200 marks and a 60-minute duration.
Copyright © 2026 Combe Labs Private Limited. All Rights Reserved.