
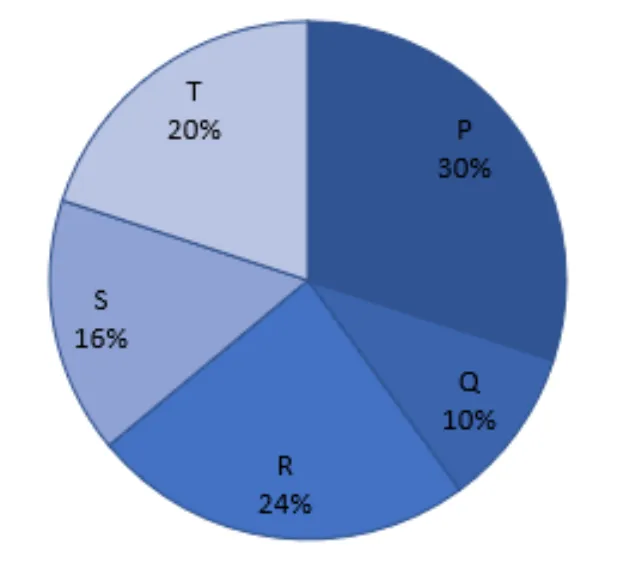
Directions (47-52) : The pie chart given below shows the percentage distribution of total Pizza sold by five (P , Q, R, S and T) different outlets of ‘Pizza hut’ in 2017. Study the pie chart given below and answer the following questions.
Note: I- Total Pizza sold by these five outlets in 2018 is 40% more than total Pizza sold by these five outlets in 2017.
II -Percentage distribution of total Pizza sold by these five outlets in 2018 is same as that of in 2017.
If total Pizza sold by P in 2017 are 1800 less than total Pizza sold by R in 2018, then find total Pizza sold by P and Q together in 2018.
Correct Answer :
28000
Solution :
Correct Option: 28000
From the pie chart, the percentage distribution of total pizzas sold by the five outlets (P, Q, R, S, and T) in 2017 is given as:
• P = 30%
• Q = 10%
• R = 24%
• S = 16%
• T = 20%
Let the total number of pizzas sold by all five outlets together in 2017 be .
According to the given notes:
1. Total pizzas sold in 2018 are 40% more than the total pizzas sold in 2017.
2. The percentage distribution of pizzas sold by the outlets in 2018 is the same as in 2017.
Therefore, we can calculate the pizzas sold by outlets P and R:
• Total pizzas sold by outlet P in 2017 = 30% of =
• Total pizzas sold by outlet R in 2018 = 24% of =
We are given that the total pizzas sold by P in 2017 are 1800 less than the total pizzas sold by R in 2018:
So, the total pizzas sold by all outlets in 2017 was 50,000.
Now, total pizzas sold by all outlets in 2018:
We need to find the total pizzas sold by P and Q together in 2018.
Combined percentage distribution of P and Q = 30% + 10% = 40%
Thus, the total pizzas sold by P and Q together in 2018 is 28000.
Access expert-curated educational resources and study materials—completely free.
Create, conduct, and manage professional online assessments with Mindyard. Perfect for teachers and institutes.
Copyright © 2026 Mindyard. All Rights Reserved.




