
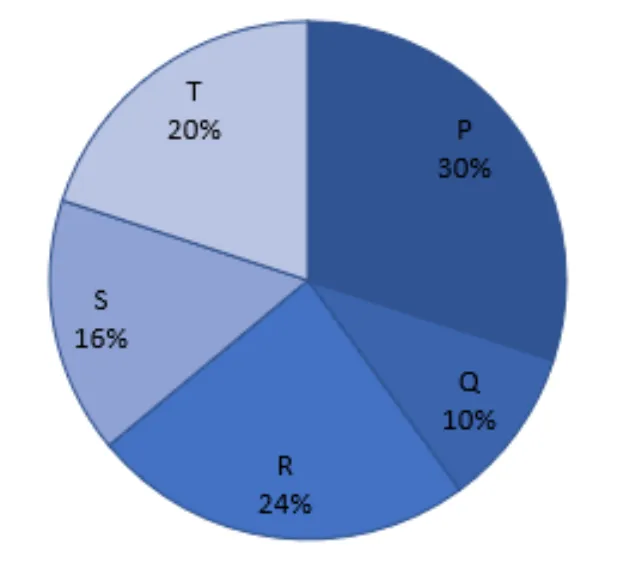
Directions (47-52) : The pie chart given below shows the percentage distribution of total Pizza sold by five (P , Q, R, S and T) different outlets of ‘Pizza hut’ in 2017. Study the pie chart given below and answer the following questions.
Note: I- Total Pizza sold by these five outlets in 2018 is 40% more than total Pizza sold by these five outlets in 2017.
II -Percentage distribution of total Pizza sold by these five outlets in 2018 is same as that of in 2017.
Total Pizza sold by S and T together in 2018 are what percent (Approx.) more or less than total Pizza sold by Q and R together in 2017?
Correct Answer :
48%
Solution :
The correct option is 48%.
From the given pie chart, the percentage distribution of total pizzas sold by the five outlets (P, Q, R, S, and T) in 2017 is as follows:
• Outlet P = 30%
• Outlet Q = 10%
• Outlet R = 24%
• Outlet S = 16%
• Outlet T = 20%
Step 1: Define total sales for 2017 and 2018
Let the total number of pizzas sold by all five outlets together in 2017 be .
According to Note I, the total number of pizzas sold in 2018 is 40% more than that in 2017.
Total pizzas sold in 2018 = .
Step 2: Calculate total pizzas sold by Q and R together in 2017
Percentage share of Q and R in 2017 = 10% + 24% = 34%.
Total pizzas sold by Q and R together in 2017 = .
Step 3: Calculate total pizzas sold by S and T together in 2018
According to Note II, the percentage distribution of total pizzas sold in 2018 is the same as in 2017.
Percentage share of S and T = 16% + 20% = 36%.
Total pizzas sold by S and T together in 2018 = .
Step 4: Find the required percentage increase
Difference in sales = .
Required percentage =
Rounding to the nearest whole percentage, the value is approximately 48%.
Access expert-curated educational resources and study materials—completely free.
Create, conduct, and manage professional online assessments with Mindyard. Perfect for teachers and institutes.
Copyright © 2026 Mindyard. All Rights Reserved.




