
Directions (48-51): The scatter chart given below shows the number of boys on (Y – axis) and number of girls (X – axis) in three different class of P, Q and R.
NOTE: If there were 10 more girls in class R then the probability of selecting a girl from R would be 40%
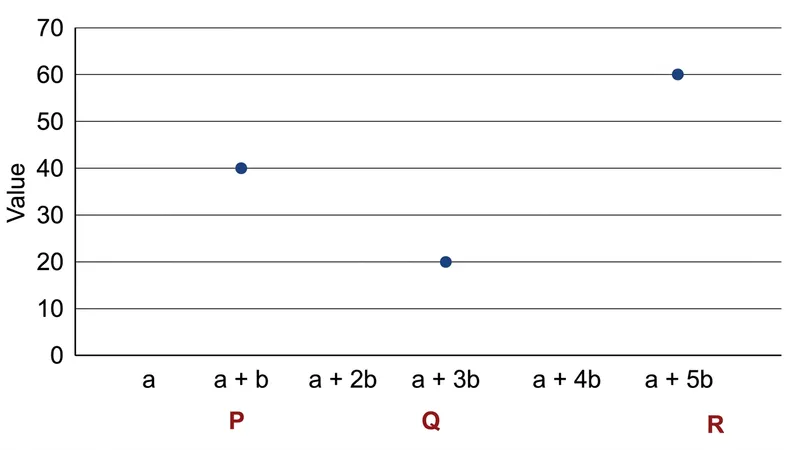
The scatter chart given below shows the number of boys on (Y – axis) and number of girls (X – axis) in three different class of P, Q and R.
NOTE: If there were 10 more girls in class R then the probability of selecting a girl from R would be 40%
If of students in class R opt science stream and the ratio of boys and girls is 7:3 and the girls who opt science stream in class R is of total girls in Q, then find the total number of student in class Q.
Correct Answer :
38
Solution :
Correct Answer: 38
Step-by-step Explanation:
1. Analyze the Scatter Chart:
From the given scatter chart, the Y-axis represents the number of boys and the X-axis represents the number of girls for three different classes: P, Q, and R.
Reading the data points from the chart:
• For class P: Number of boys = 40, and Number of girls =
• For class Q: Number of boys = 20, and Number of girls =
• For class R: Number of boys = 60, and Number of girls =
2. Determine the Number of Girls in Class R:
The note states: "If there were 10 more girls in class R then the probability of selecting a girl from R would be 40%."
Let the initial number of girls in class R be .
The number of boys in class R is .
If there are 10 more girls, the new number of girls is , and the new total number of students in R is:
The probability of selecting a girl becomes 40%, which is equal to :
Cross-multiplying to solve for :
Therefore, the number of girls in class R is:
--- (Equation 1)
3. Analyze Students Opting for Science Stream in Class R:
The total number of students in class R is:
The percentage of students opting for the science stream in class R is , which is equal to the fraction .
So, the total number of science stream students in R is:
The ratio of boys and girls among the science stream students in class R is given as 7:3.
Since the total number of science students is 10, the number of girls opting for science stream in R is:
4. Find the Number of Girls in Class Q:
The girls opting for the science stream in class R (which is 3) is equal to of the total girls in Q.
We know that .
Let be the total number of girls in class Q:
Therefore, the number of girls in class Q is:
--- (Equation 2)
5. Calculate the Total Students in Class Q:
The total number of students in class Q is the sum of boys and girls in class Q.
From the chart, the number of boys in class Q is 20.
From our calculations, the number of girls in class Q is 18.
Total students in Q:
Access expert-curated educational resources and study materials—completely free.
Create, conduct, and manage professional online assessments with Mindyard. Perfect for teachers and institutes.
Copyright © 2026 Mindyard. All Rights Reserved.




