
Directions (56-60) : Read the bar graph carefully and answer the following questions.
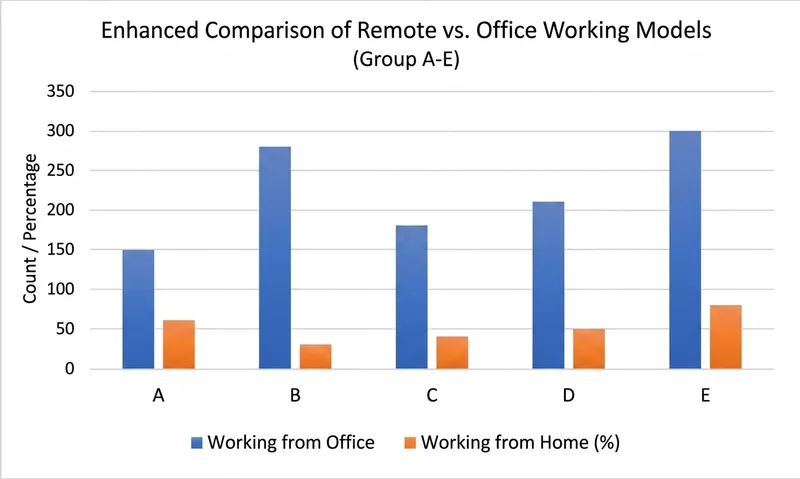
The bar graph given below shows the no. of employees working from Office and percentage of employees working from home out of total employee in five different companies.
Number of employees working in any company = Employees working from Office + Employees working from Home
Number of employee who are working from Home in company B and D together are what percentage more/less than number of employees working from Office in company C.
Correct Answer :
250/3%
Solution :
The correct answer is 250/3%.
Let's break down the solution step-by-step using the data provided in the bar graph.
1. Understanding the given data from the bar graph:
The blue bars represent the number of employees Working from Office, while the orange bars represent the Percentage of employees working from Home out of total employees.
If , then of total employees.
Therefore, .
2. Calculate number of employees working from Home in Company B:
From the graph for Company B:
- Employees working from Office = 280
- Percentage working from Home = 30%
- Percentage working from Office =
So, total employees in Company B =
Number of employees working from Home in Company B =
3. Calculate number of employees working from Home in Company D:
From the graph for Company D:
- Employees working from Office = 210
- Percentage working from Home = 50%
- Percentage working from Office =
So, total employees in Company D =
Number of employees working from Home in Company D =
4. Total employees working from Home in B and D together:
5. Number of employees working from Office in Company C:
From the graph for Company C:
- Employees working from Office = 180
6. Calculate the percentage difference:
We need to find how much percentage 330 is more than 180:
Access expert-curated educational resources and study materials—completely free.
Create, conduct, and manage professional online assessments with Mindyard. Perfect for teachers and institutes.
Copyright © 2026 Mindyard. All Rights Reserved.




