Directions: Pie chart shows income distribution of four earning member of a family out oftotal family income in the year 2016. Read the data carefully and answer the questions given below.
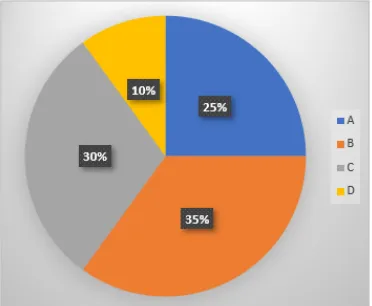
If income of B and D increased by 20% and 40% in the year 2017 over the previous year, then find the ratio of total income of B & D together in 2016 to that of in 2017?
Solution :
Given:
Step 1: Let the total family income in 2016 be Rs. 100.
Income of B in 2016 = 35
Income of D in 2016 = 10
Total income of B and D in 2016 = 35 + 10 = 45
Step 2: Find the total income of B and D in 2017
B's income in 2017 = 35 × 1.20 = 42
D's income in 2017 = 10 × 1.40 = 14
Total income of B and D in 2017 = 42 + 14 = 56
Step 3: Find the required ratio
Required Ratio = 45 : 56
Answer: 45 : 56
Completely free for students. Educators & coaching institutes get 2 months free Pro trial to create tests.
Access unlimited practice questions, detailed step-by-step solutions, and exam study materials — completely free for students.
Create and conduct professional online assessments with AI question generation, tab proctoring, and comprehensive batch management.

Prepare effectively for CAT 2017 Slot 1 with this complete question paper and detailed solutions. This paper includes all sections—Verbal Ability & Reading Comprehension (VARC), Data Interpretation & Logical Reasoning (DILR), and Quantitative Aptitude (QA)—with step-by-step explanations to help you understand concepts, improve problem-solving speed, and strengthen your exam strategy. Practicing the CAT 2017 Slot 1 paper is an excellent way to experience the actual exam pattern, difficulty level, and question types asked in the Common Admission Test. This resource is ideal for MBA aspirants targeting top IIMs and other leading B-schools.

Prepare for CAT 2017 Slot 2 with the complete question paper and detailed solutions. This paper covers all three sections—Verbal Ability & Reading Comprehension (VARC), Data Interpretation & Logical Reasoning (DILR), and Quantitative Aptitude (QA)—with clear, step-by-step explanations to help you master important concepts and improve your problem-solving speed. Solving the CAT 2017 Slot 2 paper gives you valuable insight into the actual exam pattern, question types, and difficulty level of the Common Admission Test. It is an essential practice resource for MBA aspirants aiming for admission to IIMs and other top B-schools.
Copyright © 2026 Combe Labs Private Limited. All Rights Reserved.