
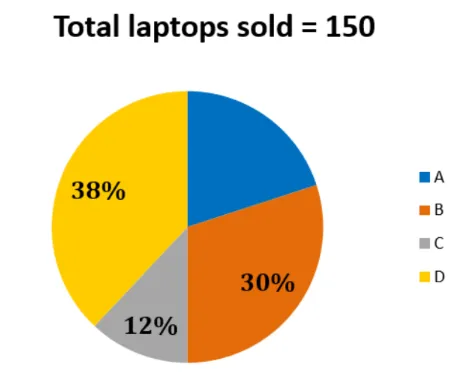
Find the difference between the number of laptops sold by the person who sold the highest number of laptops and the person who sold the least. Read the following pie chart carefully and answer the questions given below. The following pie chart shows the percentage distribution of laptops sold by four persons A, B, C and D.
Correct Answer :
39
Solution :
The correct answer is 39.
Based on the provided pie chart image, we can analyze the following data:
- Total laptops sold = 150
- Percentage sold by Person D (yellow sector) = 38%
- Percentage sold by Person B (orange sector) = 30%
- Percentage sold by Person C (grey sector) = 12%
- Percentage sold by Person A (blue sector) = 100% - (38% + 30% + 12%) = 20%
Step 1: Identify the person who sold the highest and least number of laptops.
Comparing the percentages:
- The person with the highest sales is Person D (38%).
- The person with the least sales is Person C (12%).
Step 2: Calculate the difference in percentage.
Step 3: Calculate the difference in the number of laptops sold.
To find the actual difference in laptops sold, calculate 26% of the total laptops sold (150):
Alternative Method:
We can also calculate the individual number of laptops sold by each person:
- Laptops sold by Person D = 38% of 150 = 57
- Laptops sold by Person C = 12% of 150 = 18
- Difference = 57 - 18 = 39
Thus, the difference between the number of laptops sold by the person who sold the highest number and the person who sold the least is 39.
Access expert-curated educational resources and study materials—completely free.
Create, conduct, and manage professional online assessments with Mindyard. Perfect for teachers and institutes.
Copyright © 2026 Mindyard. All Rights Reserved.




