
Following the bar graph shows percentage distribution number of challans generated in five different cities (A,B,C,D and E) in two different months (June and July) . Total number of challans generated in June and July is 800 and 1200 respectively.
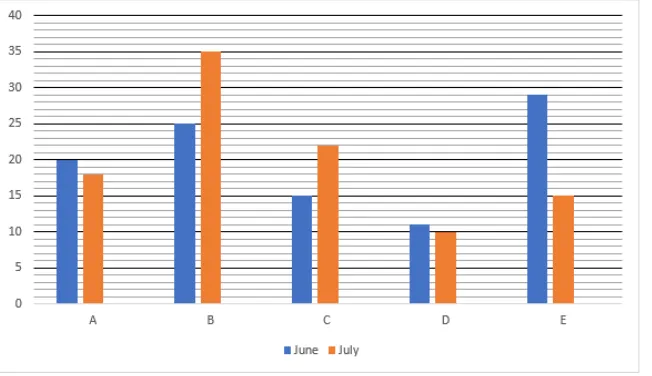
Number of challans generated in city D in July is approximately what % number of challans generated in city E in June?
Correct Answer :
52%
Solution :
Correct Answer: 52%
To find the required percentage, let us analyze the given bar graph showing the percentage distribution of challans generated across five different cities (A, B, C, D, and E) in June and July.
Given Data:
Total number of challans generated in June = 800
Total number of challans generated in July = 1200
Step 1: Calculate the number of challans generated in city D in July
From the bar graph, the orange bar for city D in July represents 10%.
Number of challans in city D (July) = 10% of 1200
Step 2: Calculate the number of challans generated in city E in June
From the bar graph, the blue bar for city E in June represents 29%.
Number of challans in city E (June) = 29% of 800
Step 3: Calculate the required percentage
We need to find what percentage the number of challans generated in city D in July is of the number of challans generated in city E in June:
Rounding off to the nearest whole number, we get 52%.
Access expert-curated educational resources and study materials—completely free.
Create, conduct, and manage professional online assessments with Mindyard. Perfect for teachers and institutes.
Copyright © 2026 Mindyard. All Rights Reserved.




