
Following the bar graph shows percentage distribution number of challans generated in five different cities (A,B,C,D and E) in two different months (June and July) . Total number of challans generated in June and July is 800 and 1200 respectively.
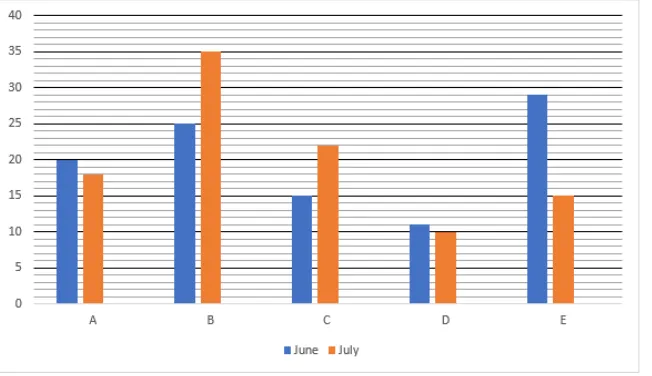
Total number of challans generated in city A and B together in July is how much more/less than the total number of challans generated in city D and E in June.
Correct Answer :
316
Solution :
The correct answer is 316.
From the given data and bar graph, we are given the total number of challans generated in two months:
Total challans in June = 800
Total challans in July = 1200
Analyzing the percentage distribution from the bar graph for each city:
1. Challans generated in City A and B together in July:
From the graph, for July (orange bars):
Percentage for City A in July = 18%
Percentage for City B in July = 35%
Total percentage for A and B in July = 18% + 35% = 53%
2. Challans generated in City D and E together in June:
From the graph, for June (blue bars):
Percentage for City D in June = 11%
Percentage for City E in June = 29%
Total percentage for D and E in June = 11% + 29% = 40%
3. Calculate the difference:
We need to find how much more the total number of challans generated in city A and B together in July is compared to that in city D and E together in June.
Therefore, the total number of challans generated in city A and B together in July is 316 more than the total number of challans generated in city D and E in June.
Access expert-curated educational resources and study materials—completely free.
Create, conduct, and manage professional online assessments with Mindyard. Perfect for teachers and institutes.
Copyright © 2026 Mindyard. All Rights Reserved.




