
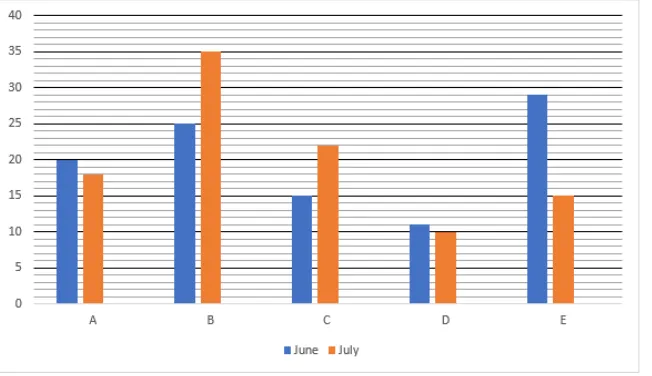
Following the bar graph shows percentage distribution number of challans generated in five different cities (A,B,C,D and E) in two different months (June and July) . Total number of challans generated in June and July is 800 and 1200 respectively.
Number of challans generated in city F is 25% more than number of challans generated in city A in both the months together. Find he total number of challans generated in city F in both the months together.
Correct Answer :
470
Solution :
The correct answer is 470.
Step 1: Understand the given data
From the problem statement, we have:
- Total number of challans generated in June = 800
- Total number of challans generated in July = 1200
From the provided bar graph, we can observe the percentage distribution of challans generated in City A:
- Percentage of challans in City A for June (blue bar) = 20%
- Percentage of challans in City A for July (orange bar) = 18%
Step 2: Calculate the number of challans generated in City A
For June:
For July:
Total challans generated in City A in both months together:
Step 3: Calculate the total number of challans generated in City F
It is given that the number of challans in City F is 25% more than the number of challans in City A in both months together.
Thus, the total number of challans generated in City F in both months together is 470.
Access expert-curated educational resources and study materials—completely free.
Create, conduct, and manage professional online assessments with Mindyard. Perfect for teachers and institutes.
Copyright © 2026 Mindyard. All Rights Reserved.




