
In the year 2023 total government project handle in Q-2 is average of private projects handled in Q-1 and Q-2 in 2022. Find the total government project handle in Q-2 in 2023 is what percentage more/less than total government projects handled in Q-1 in 2022.
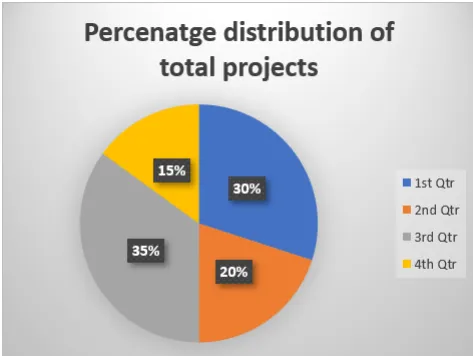
The graph given below shows the percentage distribution of total number projects (private + public) handled in 4 quarters Q-1, Q-2, Q-3 and Q-4 in years 2022. The table shows the percentage of private projects handled wrt projects handled in respective quarters and number of government projects. Read the pie chart and table carefully and answer the following questions.
| Quarters | Percentage of private projects | Number of government projects |
|---|---|---|
| Q-1 | 50 | 300 |
| Q-2 | 60 | 160 |
| Q-3 | 40 | 420 |
| Q-4 | 30 | 210 |
Correct Answer :
10
Solution :
The correct option is 10.
Let us analyze the given pie chart and table step-by-step to find the required percentage.
Step 1: Determine the total number of projects (private + government) in 2022
Let the total number of projects handled in all four quarters in the year 2022 be represented by .
From the pie chart:
The percentage distribution of total projects in 2022 is as follows:
According to the table, in Q-1, the percentage of private projects is 50%. Therefore, the percentage of government projects in Q-1 is:
We are given that the number of government projects in Q-1 is 300. Thus, we can write:
Since Q-1 accounts for 30% of the total projects () in 2022:
So, the total number of projects handled in 2022 is 2000.
Step 2: Calculate the number of private projects handled in Q-1 and Q-2 in 2022
For Q-1 (2022):
For Q-2 (2022):
Step 3: Calculate the total government projects handled in Q-2 in 2023
We are given that the total government projects handled in Q-2 in 2023 is the average of private projects handled in Q-1 and Q-2 in 2022:
Step 4: Find the percentage by which government projects in Q-2 (2023) is more/less than government projects in Q-1 (2022)
The number of government projects in Q-1 (2022) is 300 (from the table).
The number of government projects in Q-2 (2023) is 270.
Since 270 is less than 300, it is a percentage less:
Thus, the total government projects handled in Q-2 in 2023 is 10% less than the total government projects handled in Q-1 in 2022.
Access expert-curated educational resources and study materials—completely free.
Create, conduct, and manage professional online assessments with Mindyard. Perfect for teachers and institutes.
Copyright © 2026 Mindyard. All Rights Reserved.




