
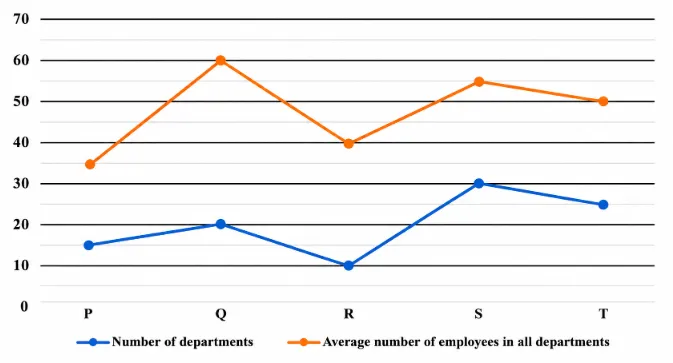
Line graph shows number of departments and average number of employees in all the departments in five different companies (P, Q, R, S and T). Read the following line graph carefully and answer the questions given below.
Find the ratio of total number of employees in all the departments of company T to that of company Q.
Correct Answer :
25 :24
Solution :
The correct answer is 25 : 24.
Step 1: Understand the given line graph data.
The line graph shows two parameters for companies P, Q, R, S, and T:
1. Blue Line: Represents the Number of departments.
2. Orange Line: Represents the Average number of employees in all departments.
Step 2: Formula for Total Employees in a Company
The total number of employees in all departments of a company is given by:
Step 3: Extract the values for Company T and Company Q from the image.
From the line graph for Company T:
• Number of departments (Blue line) = 25
• Average number of employees in all departments (Orange line) = 50
From the line graph for Company Q:
• Number of departments (Blue line) = 20
• Average number of employees in all departments (Orange line) = 60
Step 4: Find the required ratio.
We need to find the ratio of total number of employees in company T to that of company Q:
Simplifying the fraction by dividing both numerator and denominator by 50:
Thus, the required ratio is 25 : 24.
Access expert-curated educational resources and study materials—completely free.
Create, conduct, and manage professional online assessments with Mindyard. Perfect for teachers and institutes.
Copyright © 2026 Mindyard. All Rights Reserved.




