
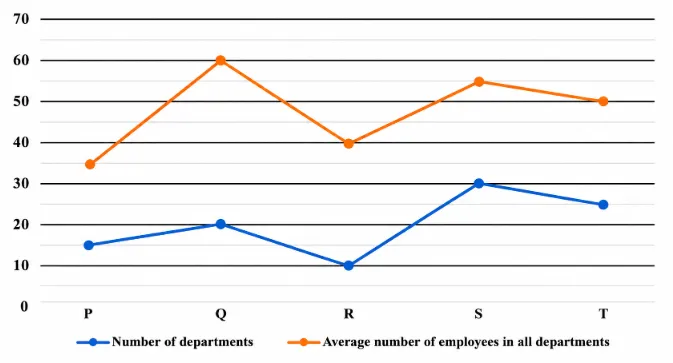
Line graph shows number of departments and average number of employees in all the departments in five different companies (P, Q, R, S and T). Read the following line graph carefully and answer the questions given below.
Find the average of total number of employees in all the departments of P, Q and S.
Correct Answer :
1125
Solution :
The correct answer is 1125.
From the given line graph, we can observe two lines for five companies (P, Q, R, S, and T):
1. Blue Line: Represents the Number of departments in each company.
2. Orange Line: Represents the Average number of employees in all departments of each company.
To find the total number of employees in any company, we multiply the number of departments by the average number of employees per department:
Let's extract the values for companies P, Q, and S from the line graph:
1. Company P:
- Number of departments = 15
- Average number of employees in all departments = 35
- Total employees in P =
2. Company Q:
- Number of departments = 20
- Average number of employees in all departments = 60
- Total employees in Q =
3. Company S:
- Number of departments = 30
- Average number of employees in all departments = 55
- Total employees in S =
Now, calculate the sum of total employees in companies P, Q, and S:
Finally, find the average of total number of employees in P, Q, and S across the 3 companies:
Access expert-curated educational resources and study materials—completely free.
Create, conduct, and manage professional online assessments with Mindyard. Perfect for teachers and institutes.
Copyright © 2026 Mindyard. All Rights Reserved.




