
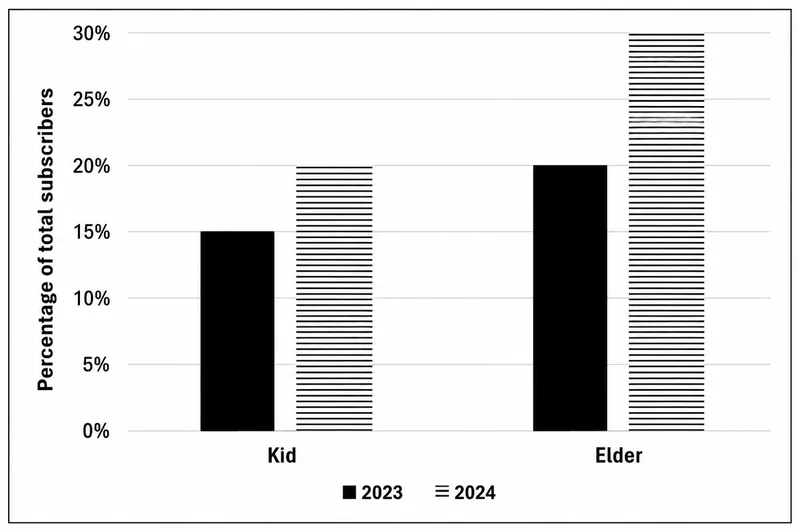
Over the top (OTT) subscribers of a platform are segregated into three categories: i) Kid, ii) Elder, and iii) Others. Some of the subscribers used one app and the others used multiple apps to access the platform. The figure below shows the percentage of the total number of subscribers in 2023 and 2024 who belong to the ‘Kid’ and ‘Elder’ categories.
The following additional facts are known about the numbers of subscribers:
1. The total number of subscribers increased by 10% from 2023 to 2024.
2. In 2024, 1/2 of the subscribers from the ‘Kid’ category and 2/3 of the subscribers from the ‘Elder’ category use one app.
3. In 2023, the number of subscribers from the ‘Kid’ category who used multiple apps was the same as the number of subscribers from the ‘Elder’ category who used one app.
4. 10,000 subscribers from the ‘Kid’ category used one app and 15,000 subscribers from the ‘Elder’ category used multiple apps in 2023.
What was the percentage increase in the number of subscribers in the ‘Elder’ category from 2023 to 2024?
Correct Answer :
65%
Solution :
The correct option is 65%.
By analyzing the provided bar chart, we can extract the following percentages for the total subscribers in each category:
• For the Kid category: The percentage of total subscribers is 15% in 2023 (indicated by the solid black bar) and 20% in 2024 (indicated by the horizontal-striped bar).
• For the Elder category: The percentage of total subscribers is 20% in 2023 (indicated by the solid black bar) and 30% in 2024 (indicated by the horizontal-striped bar).
Let us denote:
• as the total number of subscribers in 2023.
• as the number of subscribers in the 'Kid' category in 2023.
• as the number of subscribers in the 'Elder' category in 2023.
Using the percentages from the chart, we have:
Thus, the ratio of subscribers in the 'Kid' category to the 'Elder' category in 2023 is:
From the additional facts provided for 2023:
1. 10,000 subscribers from the 'Kid' category used one app.
2. 15,000 subscribers from the 'Elder' category used multiple apps.
3. The number of subscribers from the 'Kid' category who used multiple apps is equal to the number of subscribers from the 'Elder' category who used one app. Let this common number of subscribers be .
Using these relations, we can write the total subscribers in 2023 for each category as:
Equating this to our ratio from the bar chart:
Cross-multiplying and solving for :
Substituting back, we find the number of subscribers in 2023:
Since the 'Kid' category is 15% of the total, the total number of subscribers in 2023 is:
Next, we determine the numbers for 2024:
• The total number of subscribers increased by 10% from 2023 to 2024:
• From the bar chart, the 'Elder' category comprises 30% of the total subscribers in 2024:
Finally, we calculate the percentage increase in the number of subscribers in the 'Elder' category from 2023 to 2024:
Access expert-curated educational resources and study materials—completely free.
Create, conduct, and manage professional online assessments with Mindyard. Perfect for teachers and institutes.
Copyright © 2026 Mindyard. All Rights Reserved.