
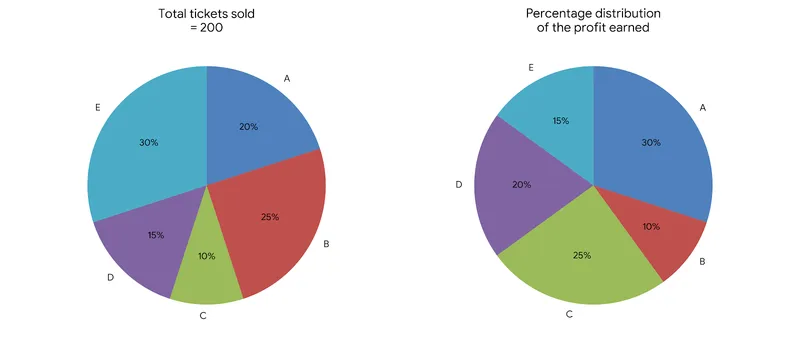
Read the following pie charts carefully and answer the questions given below.The pie chart (I) shows the percentage distribution of the total number of tickets sold by five different cinema halls on Sunday. The pie chart (II) shows the percentage distribution of the profit earned by these cinema halls on Sunday.
Note: The average profit of each ticket sold is Rs 30.
The average number of tickets sold by B and D together is how many more or less than the average number of tickets sold by A and E together.
Correct Answer :
10
Solution :
The correct option is 10.
Step-by-step Explanation:
From the first pie chart, we are given that the total number of tickets sold by all five cinema halls is 200. The percentage distribution of tickets sold by each hall is:
- Hall A: 20%
- Hall B: 25%
- Hall C: 10%
- Hall D: 15%
- Hall E: 30%
First, let's find the number of tickets sold by B and D:
- Tickets sold by B: 25% of 200
- Tickets sold by D: 15% of 200
Now, we calculate the average number of tickets sold by B and D together:
Next, let's find the number of tickets sold by A and E:
- Tickets sold by A: 20% of 200
- Tickets sold by E: 30% of 200
Now, we calculate the average number of tickets sold by A and E together:
Finally, we find the difference between the two averages:
Therefore, the average number of tickets sold by B and D together is 10 less than the average number of tickets sold by A and E together.
Access expert-curated educational resources and study materials—completely free.
Create, conduct, and manage professional online assessments with Mindyard. Perfect for teachers and institutes.
Copyright © 2026 Mindyard. All Rights Reserved.




