
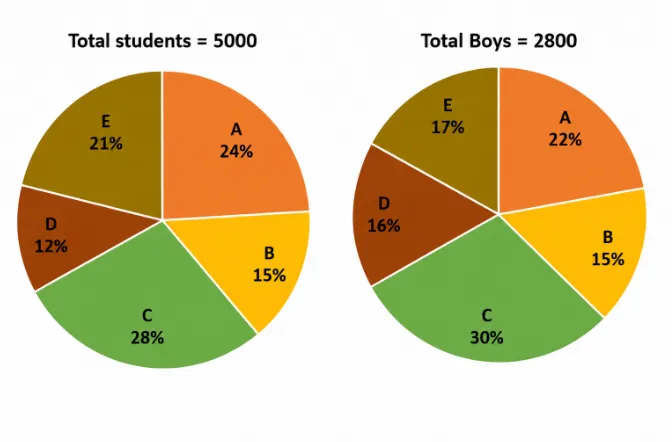
Study the pie chart given below and answer the following questions. Pie charts shows the percentage distribution of total students in five different schools (A, B, C, D and E) and percentage distribution of total boys in these five schools in year 2019.
If in 2020, the number of girls in school B increased by 20% while number of boys are decreased by 14% over the previous year . Total students in school B in year 2020 are what percent more or less than the total students in school D in year 2019?
Correct Answer :
26%
Solution :
The correct option is 26%.
Analysis of the Data from the Image:
From the given pie charts representing the year 2019:
1. Total students across all 5 schools = 5000
- School B percentage of total students = 15%
- School D percentage of total students = 12%
2. Total boys across all 5 schools = 2800
- School B percentage of total boys = 15%
Step 1: Calculate the values for School B and School D in 2019
Total students in School B in 2019:
Total boys in School B in 2019:
Total girls in School B in 2019:
Total students in School D in 2019:
Step 2: Calculate the values for School B in 2020
In 2020, the number of girls in school B increased by 20% over the previous year:
The number of boys in school B decreased by 14% over the previous year:
Note that 14% = % = .
Total students in School B in 2020:
Step 3: Percentage comparison with School D in 2019
We need to find how much percent the total students in school B in 2020 (756) are more than the total students in school D in 2019 (600):
Percentage more:
Therefore, total students in school B in 2020 are 26% more than total students in school D in 2019.
Access expert-curated educational resources and study materials—completely free.
Create, conduct, and manage professional online assessments with Mindyard. Perfect for teachers and institutes.
Copyright © 2026 Mindyard. All Rights Reserved.




