
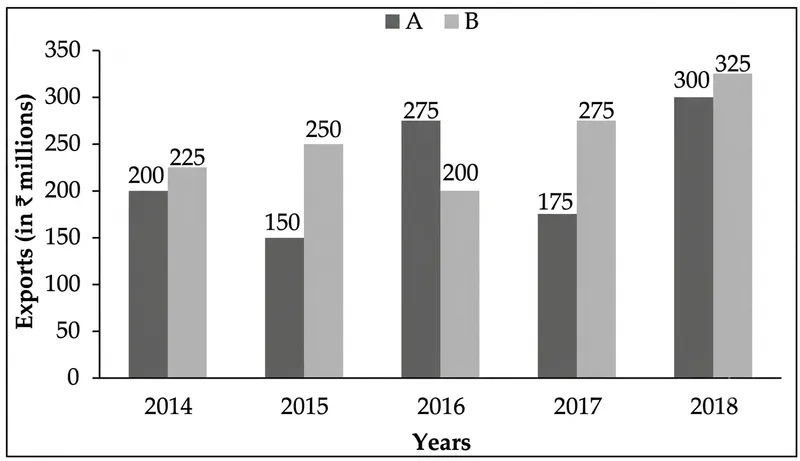
The following bar graph shows exports of cars of type A and B (in `millions) from 2014 to 2018.
What is the ratio of the total exports of cars of type A in 2014 and 2017 to the total exports of cars of type B in 2015 and 2016?
Correct Answer :
5 : 6
Solution :
To find the required ratio, we first extract the values of the exports for the specified types of cars in the given years from the provided bar graph:
1. Total exports of cars of type A in 2014 and 2017:
From the graph, the dark grey bars represent type A cars:
• Exports of type A in 2014 = 200 million
• Exports of type A in 2017 = 175 million
Summing these values:
2. Total exports of cars of type B in 2015 and 2016:
From the graph, the light grey bars represent type B cars:
• Exports of type B in 2015 = 250 million
• Exports of type B in 2016 = 200 million
Summing these values:
3. Ratio of the total exports of type A (2014 and 2017) to type B (2015 and 2016):
Dividing both the numerator and the denominator by their greatest common divisor (75):
Thus, the simplified ratio is 5 : 6.
Access expert-curated educational resources and study materials—completely free.
Create, conduct, and manage professional online assessments with Mindyard. Perfect for teachers and institutes.
Copyright © 2026 Mindyard. All Rights Reserved.




