
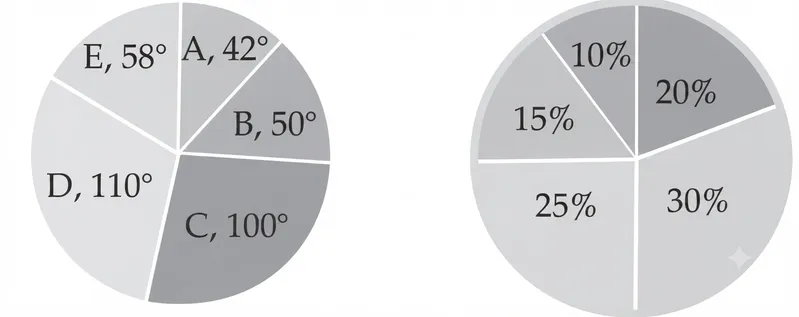
The following pie charts show the data of the number of appeared and passed students of class 12 in sections A, B, C, D and E.
How many students failed in Section C?
Correct Answer :
300
Solution :
The correct answer is 300.
Based on the data and the pie charts provided in the question:
- The total number of students who appeared for the exam across all sections is 1800, which is represented by the first pie chart with angles totaling 360°.
- The total number of students who passed the exam across all sections is 800, which is represented by the second pie chart with percentages totaling 100%.
From the first pie chart, Section C has a central angle of 100°.
To find the number of students who appeared from Section C:
From the second pie chart, the percentage of passed students belonging to Section C is 25%.
To find the number of students who passed from Section C:
The number of students who failed in Section C is calculated by subtracting the number of passed students from the number of appeared students in Section C:
Access expert-curated educational resources and study materials—completely free.
Create, conduct, and manage professional online assessments with Mindyard. Perfect for teachers and institutes.
Copyright © 2026 Mindyard. All Rights Reserved.