
The following pie charts shows the percentage distribution of total students selected in SSC examination and percentage distribution of total boys selected students from six different zones. Study the following pie chart carefully and answer the given questions.
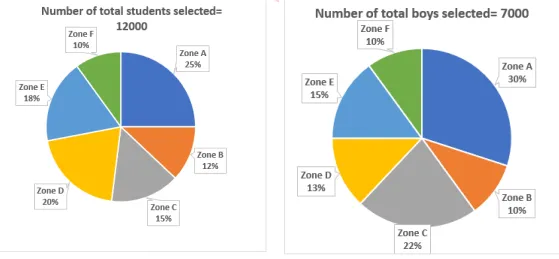
Total number of boys selected from zone A & zone F together is what percentage of total number of students selected from zone A, zone C and zone F together?
Correct Answer :
Solution :
Correct Answer:
Step-by-Step Explanation:
From the provided pie charts, we can observe the following overall counts and percentage distributions across different zones:
1. Total number of selected students = 12000
- Selected students from Zone A = 25%
- Selected students from Zone C = 15%
- Selected students from Zone F = 10%
2. Total number of selected boys = 7000
- Selected boys from Zone A = 30%
- Selected boys from Zone F = 10%
Step 1: Calculate the total number of boys selected from Zone A & Zone F together.
Number of boys from Zone A = 30% of 7000
Number of boys from Zone F = 10% of 7000
Total boys from Zone A and Zone F together:
Step 2: Calculate the total number of students selected from Zone A, Zone C & Zone F together.
Number of students from Zone A = 25% of 12000
Number of students from Zone C = 15% of 12000
Number of students from Zone F = 10% of 12000
Total students from Zone A, Zone C, and Zone F together:
Step 3: Calculate the required percentage.
Percentage:
Hence, the total number of boys selected from Zone A & Zone F together is of the total number of students selected from Zone A, Zone C, and Zone F together.
Access expert-curated educational resources and study materials—completely free.
Create, conduct, and manage professional online assessments with Mindyard. Perfect for teachers and institutes.
Copyright © 2026 Mindyard. All Rights Reserved.




