
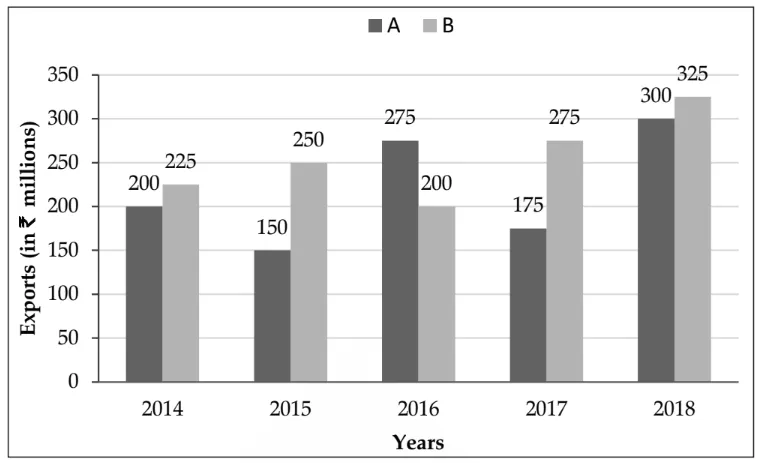
The given bar graph shows exports of cars of type A and B (in ₹ millions) from 2014 to 2018. Study the graph and answer the question that follows.
What is the ratio of the total exports of cars of type A in 2014 and 2018 to the total exports of cars of type B in 2015 and 2017?
Correct Answer :
20 : 21
Solution :
The correct answer is 20 : 21.
By carefully reading the bar graph, we can extract the following export values (in ₹ millions) for cars of type A and type B across all five years:
Type A exports:
2014 → 200 | 2015 → 150 | 2016 → 275 | 2017 → 175 | 2018 → 300
Type B exports:
2014 → 225 | 2015 → 250 | 2016 → 200 | 2017 → 275 | 2018 → 325
Now, the question asks for the ratio of the total exports of Type A in 2014 and 2018 to the total exports of Type B in 2015 and 2017.
Step 1: Calculate the total exports of Type A in 2014 and 2018.
Step 2: Calculate the total exports of Type B in 2015 and 2017.
Step 3: Form the ratio and simplify.
To simplify, find the GCD of 500 and 525. Both are divisible by 25:
Therefore, the required ratio of total exports of Type A in 2014 and 2018 to total exports of Type B in 2015 and 2017 is 20 : 21.
Access expert-curated educational resources and study materials—completely free.
Create, conduct, and manage professional online assessments with Mindyard. Perfect for teachers and institutes.
Copyright © 2026 Mindyard. All Rights Reserved.




