
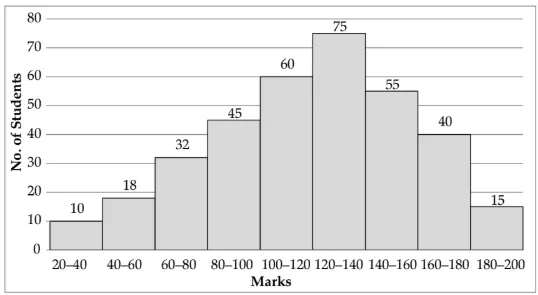
The given histogram represents the marks of students in Mathematics test of a certain class. The total number of students is 350.
Study the graph and answer the question that follows.
What is the ratio of the total number of students who scored 140 marks and above to the total number of students who scored marks between 60 to 120?
Correct Answer :
110 : 137
Solution :
The correct option is 110 : 137.
To find the required ratio, we analyze the data shown in the histogram step-by-step:
Step 1: Calculate the total number of students who scored 140 marks and above
From the histogram, the intervals representing marks of 140 and above are:
- Marks 140–160: 55 students
- Marks 160–180: 40 students
- Marks 180–200: 15 students
Step 2: Calculate the total number of students who scored marks between 60 to 120
From the histogram, the intervals representing marks between 60 and 120 are:
- Marks 60–80: 32 students
- Marks 80–100: 45 students
- Marks 100–120: 60 students
Step 3: Determine the ratio
We divide the number of students who scored 140 and above by the number of students who scored between 60 and 120:
Since 110 and 137 share no common factors other than 1, the ratio remains in its simplest form as 110 : 137.
Access expert-curated educational resources and study materials—completely free.
Create, conduct, and manage professional online assessments with Mindyard. Perfect for teachers and institutes.
Copyright © 2026 Mindyard. All Rights Reserved.




