
The line graph shows rd of the total items sold by five different shops in two different years.
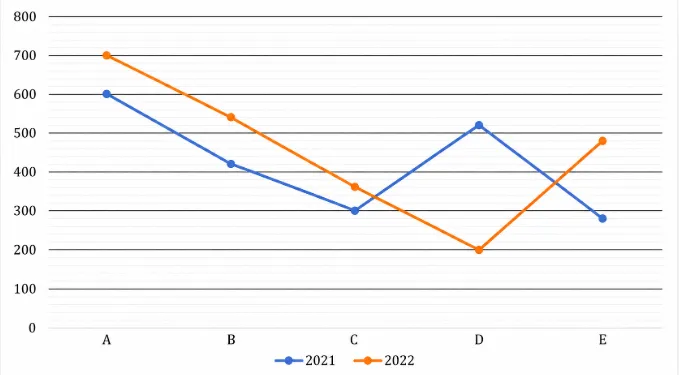
Note: (i). Total number of items sold by each shops in 2023 is 20% more than that in 2021.
(ii). The total number of items sold by each shops in each year, which is given in the line graph, is one-third of the total items sold.
Find the ratio of the total number of items sold by B in 2022 to the total number of items sold by C in 2023.
Correct Answer :
55 : 36
55 : 36
Solution :
Given:
Step 1: Find the total items sold by Shop B in 2022
From the graph, one-third of the items sold by Shop B in 2022 = 550.
Total items sold by Shop B in 2022 = 550 × 3 = 1650.
Step 2: Find the total items sold by Shop C in 2023
From the graph, one-third of the items sold by Shop C in 2021 = 300.
Total items sold by Shop C in 2021 = 300 × 3 = 900.
Total items sold by Shop C in 2023 = 900 × 120% = 1080.
Step 3: Find the required ratio
Required Ratio = 1650 : 1080
= 55 : 36
Answer: 55 : 36
Access expert-curated educational resources and study materials—completely free.
Create, conduct, and manage professional online assessments with Mindyard. Perfect for teachers and institutes.
Copyright © 2026 Mindyard. All Rights Reserved.




