
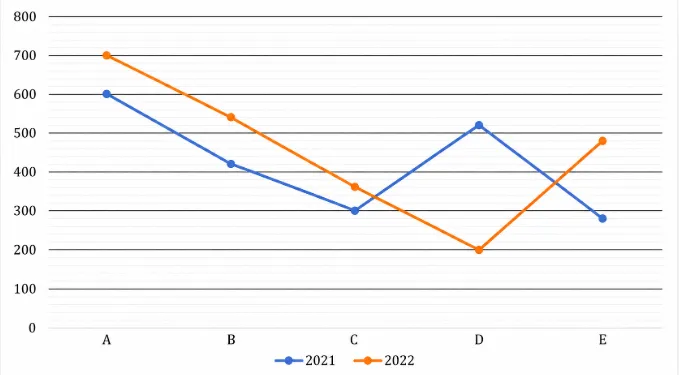
The line graph shows rd of the total items sold by five different shops in two different years.
Note: (i). Total number of items sold by each shops in 2023 is 20% more than that in 2021.
(ii). The total number of items sold by each shops in each year, which is given in the line graph, is one-third of the total items sold.
Find the sum of the total number of items sold by A, B and C in 2023.
Correct Answer :
4752
Solution :
The correct option is 4752.
Step 1: Understand the data given in the question and image
From the given line graph, we can see two lines representing the data for five different shops (A, B, C, D, and E) across two years: 2021 (blue line) and 2022 (orange line).
According to Note (ii), the value shown in the graph for each shop in a given year is equal to rd of the total items sold by that shop in that year.
Let's read the values given in the line graph for the year 2021 (blue line):
• Shop A in 2021 = 600
• Shop B in 2021 = 420
• Shop C in 2021 = 300
Step 2: Calculate the total number of items sold by shops A, B, and C in 2021
Since the values in the line graph represent rd of the total items sold:
Sum of graph values for A, B, and C in 2021:
Total items sold by A, B, and C together in 2021:
Step 3: Calculate the total number of items sold by A, B, and C in 2023
According to Note (i), the total number of items sold by each shop in 2023 is 20% more than that in 2021.
Therefore, the sum of items sold by A, B, and C in 2023 is 120% (or 1.2 times) of the total items sold by them in 2021:
Thus, the sum of the total number of items sold by A, B, and C in 2023 is 4752.
Access expert-curated educational resources and study materials—completely free.
Create, conduct, and manage professional online assessments with Mindyard. Perfect for teachers and institutes.
Copyright © 2026 Mindyard. All Rights Reserved.




