
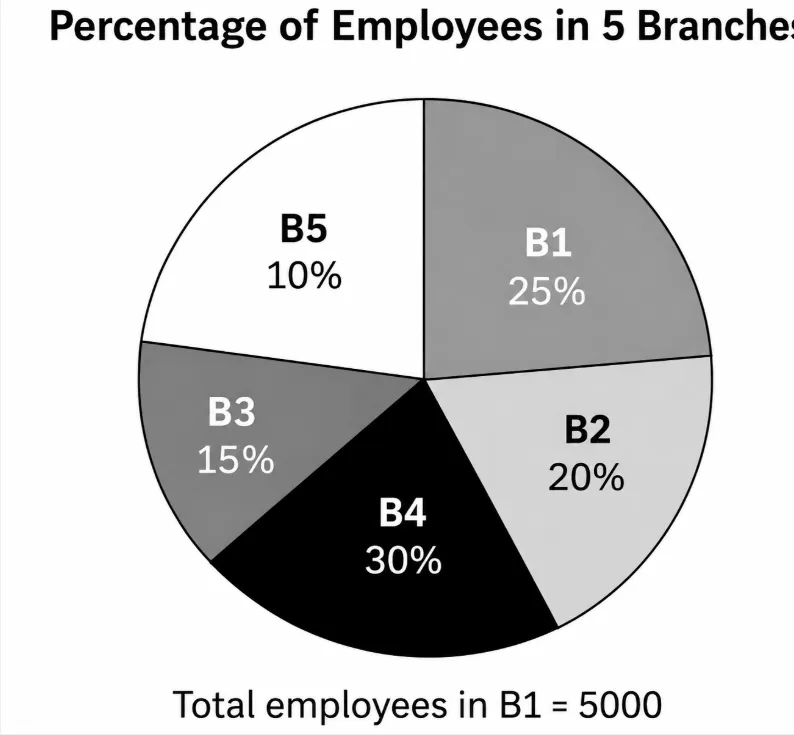
The pie chart shows the percentage of employees in 5 branches. Total employees in B1 = 5000. In which of the following sets of branches is the average number of employees 4000?
Correct Answer :
B2,B5 and B4
B2,B5 and B4
Solution :
Solution:
Since B1 = 25% of the total employees and the number of employees in B1 is 5000, the total number of employees is:
Now calculate the number of employees in each branch.
B2:
B3:
B4:
B5:
Now check the average of branches B2, B4 and B5.
Answer: B2, B4 and B5.
Access expert-curated educational resources and study materials—completely free.
Create, conduct, and manage professional online assessments with Mindyard. Perfect for teachers and institutes.
Copyright © 2026 Mindyard. All Rights Reserved.