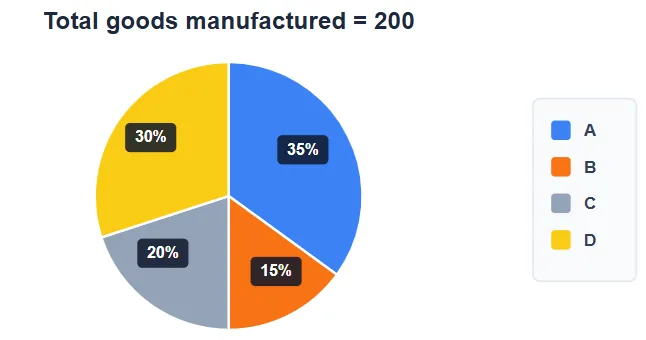
The pie chart shows the total number of (sold and unsold) goods by four companies (A, B, C & D). The table shows the items sold out of total good manufactured by these companies.
| Companies | Goods sold out of total goods manufactured |
|---|---|
| A | 90% |
| B | 80% |
| C | 75% |
| D | 4X% |
Find the difference between average number of goods sold by B & C and number of unsold goods of D.
Solution :
The correct answer is 14.
Based on the provided pie chart and table, let us break down the solution step-by-step:
Step 1: Understand the distribution from the pie chart
The pie chart displays the total number of goods manufactured by four companies (A, B, C, and D). From the image, we can identify the following values:
• Total goods manufactured = 200
• Company A (represented in blue) = 35% of the total
• Company B (represented in orange) = 15% of the total
• Company C (represented in grey) = 20% of the total
• Company D (represented in yellow) = 30% of the total
Let us calculate the total goods manufactured by each company:
Step 2: Calculate the goods sold by B and C
Using the table, the percentage of manufactured goods sold by each company is:
• Company B sold 80% of its manufactured goods.
• Company C sold 75% of its manufactured goods.
Let us calculate the number of sold goods:
Step 3: Find the average of goods sold by B & C
The average number of goods sold by B and C is given by:
Step 4: Determine the unsold goods of D
Let UD be the number of unsold goods of D. We are given that the difference between the average number of goods sold by B & C and the number of unsold goods of D is 14.
Since the total number of goods of D is 60, the unsold goods UD must be less than 27 to satisfy the given options:
Therefore, the difference between the average number of goods sold by B & C and the unsold goods of D is exactly 14.
Completely free for students. Educators & coaching institutes get 2 months free Pro trial to create tests.
Access unlimited practice questions, detailed step-by-step solutions, and exam study materials — completely free for students.
Create and conduct professional online assessments with AI question generation, tab proctoring, and comprehensive batch management.
A comprehensive SSC MTS 2026 Mock Test 4 designed to help aspirants strengthen their preparation and improve their performance for the Staff Selection Commission Multi-Tasking Staff examination. This mock test covers all major sections including Numerical and Mathematical Ability, Reasoning Ability and Problem Solving, General Awareness, and English Language and Comprehension. It includes a balanced combination of conceptual, analytical, and exam-oriented multiple-choice questions aligned with the latest SSC MTS syllabus and exam pattern. Ideal for practice, revision, self-evaluation, accuracy improvement, speed enhancement, and effective time management, this mock test helps candidates assess their exam readiness, identify improvement areas, and build confidence for the SSC MTS 2026 examination
A comprehensive SSC MTS 2026 Mock Test 3 designed to help aspirants prepare thoroughly for the Staff Selection Commission Multi-Tasking Staff examination. This mock test covers all important sections including Numerical and Mathematical Ability, Reasoning Ability and Problem Solving, General Awareness, and English Language and Comprehension. It features a carefully curated set of multiple-choice questions that test conceptual understanding, logical reasoning, problem-solving skills, speed, and accuracy in accordance with the latest SSC MTS exam pattern. Ideal for practice, revision, self-assessment, performance evaluation, and time management improvement, this mock test enables candidates to identify strengths and weaknesses while building confidence for the SSC MTS 2026 examination.
Copyright © 2026 Combe Labs Private Limited. All Rights Reserved.