
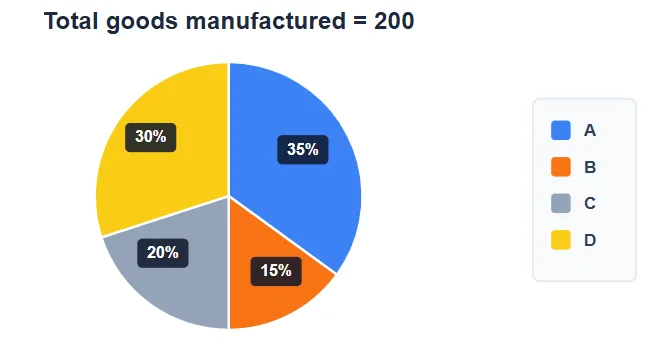
The pie chart shows the total number of (sold and unsold) goods by four companies (A, B, C & D). The table shows the items sold out of total good manufactured by these companies.
| Companies | Goods sold out of total goods manufactured |
|---|---|
| A | 90% |
| B | 80% |
| C | 75% |
| D | 4X% |
Out of the total goods sold by A, 53 are defective and rest are non defective, and the ratio of non-defective goods sold by A to non-defective goods unsold by A is 2:1. Find the defective goods sold by A.
Correct Answer :
2
Solution :
The correct answer is 2.
Step 1: Analyze the data from the pie chart and table
From the pie chart titled "Total goods manufactured = 200", we obtain the following data for Company A:
• Total goods manufactured by all four companies = 200
• Percentage of goods manufactured by Company A = 35%
From the table showing goods sold out of total manufactured:
• Percentage of manufactured goods sold by Company A = 90%
Step 2: Calculate total goods manufactured by Company A
Step 3: Calculate total goods sold and unsold by Company A
Step 4: Determine non-defective goods sold and unsold by Company A
Out of the 63 total goods sold by Company A, 53 are defective.
The ratio of non-defective goods sold by A to non-defective goods unsold by A is given as 2 : 1.
Step 5: Calculate defective unsold goods by Company A
Thus, the required value is 2.
Access expert-curated educational resources and study materials—completely free.
Create, conduct, and manage professional online assessments with Mindyard. Perfect for teachers and institutes.
Copyright © 2026 Mindyard. All Rights Reserved.




