
The pie given below shows the total population in five cities (A, B, C, D, E).
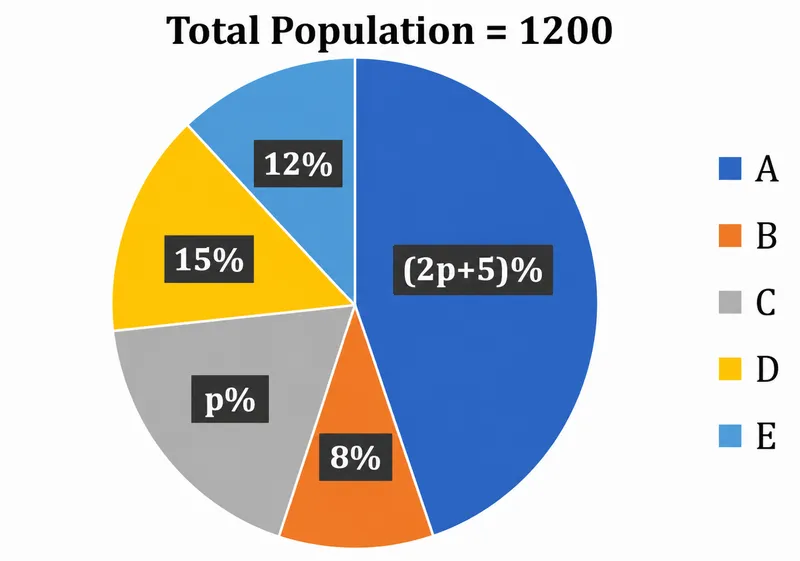
The population of cities D and E is what percentage more/less than the total population of A and C
Correct Answer :
58.46%
Solution :
Correct Answer: 58.46%
Based on the provided pie chart, the total population is 1200, distributed among five cities (A, B, C, D, E) with the following percentage values:
- City A: (2p + 5)%
- City B: 8%
- City C: p%
- City D: 15%
- City E: 12%
Step 1: Solve for p
Since the sum of all percentages in a pie chart must be equal to 100%, we write the equation:
Combine the like terms:
Subtract 40 from both sides:
Divide by 3:
Step 2: Find the percentage shares of the cities
Substitute the value of p = 20 back into the percentage expressions:
- Population percentage of A = 2(20) + 5 = 45%
- Population percentage of C = 20%
- Population percentage of D = 15%
- Population percentage of E = 12%
Step 3: Calculate the total percentages for the groups
- Total percentage of cities D and E:
- Total percentage of cities A and C:
Step 4: Calculate how much less the population of D and E is than A and C
The difference in percentage points is:
Now, find the percentage difference relative to the total of A and C:
Thus, the population of cities D and E is 58.46% less than the total population of A and C.
Access expert-curated educational resources and study materials—completely free.
Create, conduct, and manage professional online assessments with Mindyard. Perfect for teachers and institutes.
Copyright © 2026 Mindyard. All Rights Reserved.




