
The proportion of expenditure on various items by two families A and B are represented in the following Bar Charts:
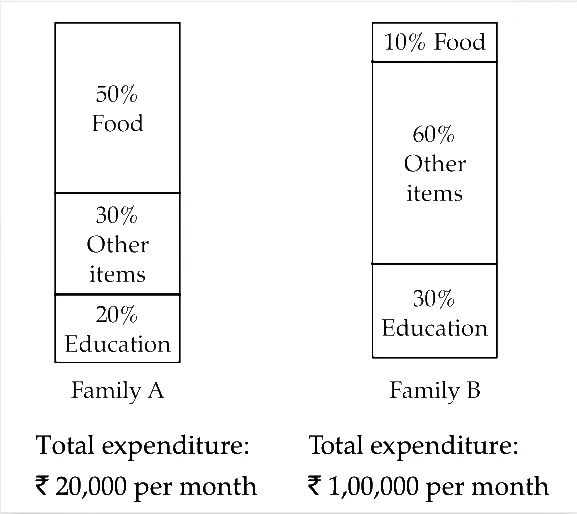
From these charts, we can conclude that
Correct Answer :
Family A and Family B spent the same amount on food.
Solution :
The correct option is: Family A and Family B spent the same amount on food.
To determine the correct conclusion, we calculate and compare the actual monetary expenditure on food for both families using the data labels provided in the bar charts.
1. Analysis of Family A:
From the bar chart for Family A, we observe the following values:
• Total monthly expenditure = ₹20,000
• Proportion spent on food = 50%
Using these values, we calculate the expenditure on food:
2. Analysis of Family B:
From the bar chart for Family B, we observe the following values:
• Total monthly expenditure = ₹1,00,000
• Proportion spent on food = 10%
Using these values, we calculate the expenditure on food:
Conclusion:
Comparing the calculated values:
Therefore, we can conclude that both Family A and Family B spent the exact same amount of money on food.
Access expert-curated educational resources and study materials—completely free.
Create, conduct, and manage professional online assessments with Mindyard. Perfect for teachers and institutes.
Copyright © 2026 Mindyard. All Rights Reserved.




