The Sustainability Index (SI) of a country at a point in time is an integer between 1 and 100.
This question is related to SI of six countries - A, B, C, D, E, and F - at three different points in time - 2016, 2020, and 2024.
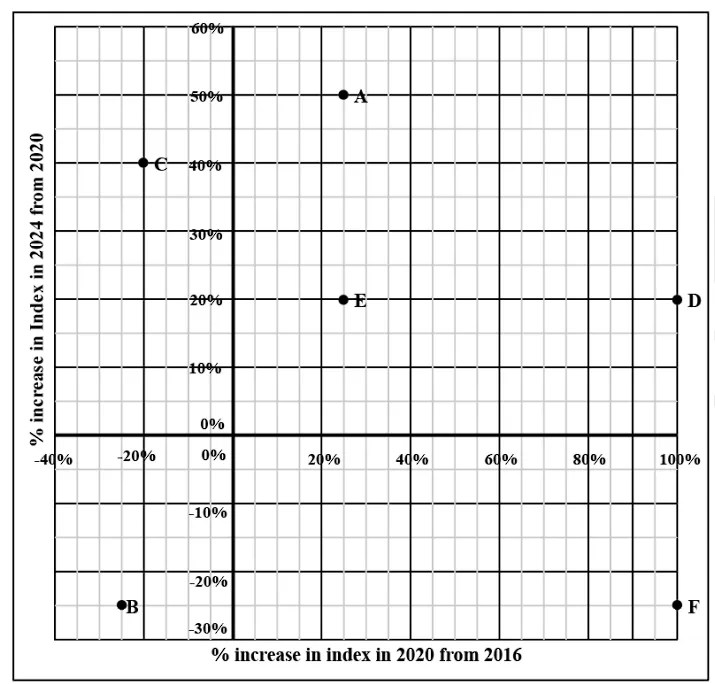
The plot represents the exact changes in their SI, with X-coordinate representing % increase in 2020 from 2016, i.e., (SI in 2020 minus SI in 2016) / (SI in 2016), and Y-coordinate representing % increase in 2024 from 2020. At any point in time, the country with highest SI is ranked 1, while the country with the lowest SI is ranked 6.
The following additional facts are known.
1. In 2016, B, C, E, and A had ranks 1, 2, 3, and 4 respectively.
2. F had lower SI than any other country in 2016, 2020, and 2024.
3. In 2024, E was the only country with SI of 90.
4. The range of SI of the six countries was 60 in 2016 as well as in 2024.
What was the SI of B in 2024?
Solution :
The correct answer is 45.
To determine the Sustainability Index (SI) of country B in 2024, we need to carefully read the given plot and apply the facts provided step-by-step.
Step 1: Understand the Grid and Coordinates from the Image
By observing the provided image, we can establish the scale of the axes. The X-axis represents the percentage increase in 2020 from 2016, and the Y-axis represents the percentage increase in 2024 from 2020. Between 0% and 20% on the X-axis, there are four subdivisions. This indicates that each grid square represents a 5% increment. The same 5% increment applies to the Y-axis grid lines.
Let's define the formula for the SI in 2024 based on the SI in 2016 using the X and Y coordinate percentage changes:
Step 2: Read the Data Points for Specific Countries
Let's extract the exact coordinates from the plot for countries E, C, B, and F:
- Country E: The point is on the first vertical line past 20% (X = 25%) and exactly on the 20% horizontal line (Y = 20%).
- Country C: The point is on the fourth vertical line to the left of the Y-axis (X = -20%) and exactly on the 40% horizontal line (Y = 40%).
- Country B: The point is on the fifth vertical line to the left of the Y-axis (X = -25%) and exactly halfway between the -20% and -30% horizontal lines (Y = -25%).
- Country F: The point is on the furthest right major line (X = 100%) and on the -25% horizontal line (Y = -25%).
Now, we convert these percentages into their respective growth multipliers from 2016 to 2024:
- Multiplier for E: (1 + 0.25) × (1 + 0.20) = 1.25 × 1.2 = 1.5
- Multiplier for C: (1 - 0.20) × (1 + 0.40) = 0.8 × 1.4 = 1.12
- Multiplier for B: (1 - 0.25) × (1 - 0.25) = 0.75 × 0.75 = 0.5625 (or 9/16)
- Multiplier for F: (1 + 1.00) × (1 - 0.25) = 2.0 × 0.75 = 1.5
Step 3: Determine the SI of Country E in 2016
According to Fact 3, E was the only country with an SI of 90 in 2024. Using its multiplier, we can find its SI in 2016:
Step 4: Determine the SI of Country C in 2016
According to Fact 1, the ranking of countries in 2016 from highest to lowest was B (Rank 1), C (Rank 2), E (Rank 3), and A (Rank 4). Since E had an SI of 60, country C must have an SI strictly greater than 60. Let's look at C's multiplier:
Because the SI must always be an integer, C2016 must be a multiple of 25. The only multiples of 25 greater than 60 are 75 and 100. If C2016 were 100, its 2024 SI would be 100 × 1.12 = 112, which violates the rule that the SI cannot exceed 100. Therefore, C2016 must be exactly 75.
Step 5: Determine the SI of Country B in 2016
Since country B was Rank 1 in 2016, its SI must be strictly greater than country C's SI of 75. Let's apply B's multiplier:
For B2024 to be an integer, B2016 must be a multiple of 16. The possible multiples of 16 strictly greater than 75 are 80 and 96.
To find out which one is correct, we utilize Fact 2 and Fact 4. Fact 2 states F had the lowest SI (Rank 6) at all times, and Fact 4 states the range (Maximum SI − Minimum SI) was exactly 60 in both 2016 and 2024. In 2016, B is the maximum and F is the minimum.
If B2016 = 96:
The minimum F2016 would be 96 − 60 = 36.
Using F's multiplier, F2024 = 36 × 1.5 = 54.
Since the range in 2024 is also 60, the maximum SI in 2024 would have to be 54 + 60 = 114, which exceeds the maximum possible value of 100. Thus, B2016 cannot be 96.
Therefore, B2016 must be 80. (We can quickly verify this works: F2016 = 80 − 60 = 20, making F2024 = 20 × 1.5 = 30. The maximum in 2024 is 30 + 60 = 90, which perfectly matches country E's 2024 SI of 90).
Step 6: Calculate the SI of Country B in 2024
Now that we have definitively proven B's 2016 SI is 80, we can easily calculate its 2024 SI using the derived multiplier:
The SI of country B in 2024 was exactly 45.
Completely free for students. Educators & coaching institutes get 2 months free Pro trial to create tests.
Access unlimited practice questions, detailed step-by-step solutions, and exam study materials — completely free for students.
Create and conduct professional online assessments with AI question generation, tab proctoring, and comprehensive batch management.

Prepare effectively for CAT 2017 Slot 1 with this complete question paper and detailed solutions. This paper includes all sections—Verbal Ability & Reading Comprehension (VARC), Data Interpretation & Logical Reasoning (DILR), and Quantitative Aptitude (QA)—with step-by-step explanations to help you understand concepts, improve problem-solving speed, and strengthen your exam strategy. Practicing the CAT 2017 Slot 1 paper is an excellent way to experience the actual exam pattern, difficulty level, and question types asked in the Common Admission Test. This resource is ideal for MBA aspirants targeting top IIMs and other leading B-schools.
Prepare for CAT 2017 Slot 2 with the complete question paper and detailed solutions. This paper covers all three sections—Verbal Ability & Reading Comprehension (VARC), Data Interpretation & Logical Reasoning (DILR), and Quantitative Aptitude (QA)—with clear, step-by-step explanations to help you master important concepts and improve your problem-solving speed. Solving the CAT 2017 Slot 2 paper gives you valuable insight into the actual exam pattern, question types, and difficulty level of the Common Admission Test. It is an essential practice resource for MBA aspirants aiming for admission to IIMs and other top B-schools.
Copyright © 2026 Combe Labs Private Limited. All Rights Reserved.