
The two plots below show data for four companies code-named A, B, C, and D over three years - 2019, 2020, and 2021.
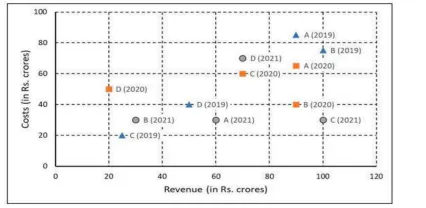
The first plot shows the revenues and costs incurred by the companies during these years. For example, in 2021, company C earned Rs. 100 crores in revenue and spent Rs. 30 crores. The profit of a company is defined as its revenue minus its costs.
The second plot shows the number of employees employed by the company (employee strength) at the start of each of these three years, as well as the number of new employees hired each year (new hires). For example, Company B had 250 employees at the start of 2021, and 30 new employees joined the company during the year.
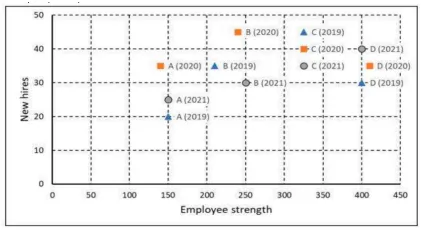
Profit per employee is the ratio of a company's profit to its employee strength. For this purpose, the employee strength in a year is the average of the employee strength at the beginning of that year and the beginning of the next year. In 2020, which of the four companies had the highest profit per employee?
Correct Answer :
Company B
Access expert-curated educational resources and study materials—completely free.
Create, conduct, and manage professional online assessments with Mindyard. Perfect for teachers and institutes.
Copyright © 2026 Mindyard. All Rights Reserved.