
Two companies A and B handled private projects handled in Q-4. A handled 25% more projects than that of B. find the projects handled by B.
The graph given below shows the percentage distribution of total number projects (private + public) handled in 4 quarters Q-1, Q-2, Q-3 and Q-4 in years 2022. The table shows the percentage of private projects handled wrt projects handled in respective quarters and number of government projects. Read the pie chart and table carefully and answer the following questions.
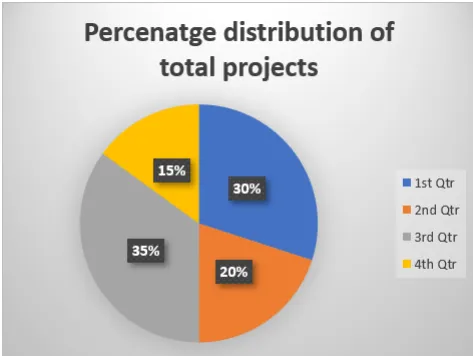
| Quarters | Percentage of private projects | Number of government projects |
|---|---|---|
| Q-1 | 50 | 300 |
| Q-2 | 60 | 160 |
| Q-3 | 40 | 420 |
| Q-4 | 30 | 210 |
Correct Answer :
40
Solution :
The correct answer is 40.
Step-by-step Explanation:
1. Analyze the data for Quarter-4 (Q-4):
From the table, for Quarter 4 (Q-4), we have:
Percentage of private projects = 30%
Number of government projects = 210
Since the total projects handled consist of private and government (public) projects, the percentage of government projects is:
2. Calculate the total number of projects in Q-4:
Let represent the total number of projects in Q-4.
Since 70% of the total projects are government projects, we have:
Solving for :
3. Calculate the number of private projects in Q-4:
The number of private projects in Q-4 is 30% of the total projects:
4. Calculate the projects handled by company B:
Let the number of private projects handled by company B be .
Since company A handled 25% more projects than company B, the number of projects handled by A is:
Together, companies A and B handled the 90 private projects in Q-4:
Solving for :
Therefore, the number of projects handled by B is 40.
Access expert-curated educational resources and study materials—completely free.
Create, conduct, and manage professional online assessments with Mindyard. Perfect for teachers and institutes.
Copyright © 2026 Mindyard. All Rights Reserved.




