
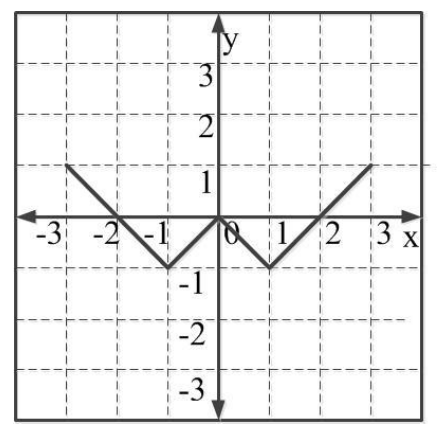
Which of the following functions describe the graph shown in the below figure?
Correct Answer :
𝑦 = ||𝑥| − 1| − 1
Solution :
The correct answer is: 𝑦 = ||𝑥| − 1| − 1
Step-by-Step Analysis:
By carefully examining the provided graph, we can extract key coordinate points through which the curve passes:
• At , the graph passes through the origin, so .
• At and , the graph has local minimum points at .
• At and , the graph intersects the x-axis, so .
• At and , the graph reaches .
Let's substitute these key x-values into our correct function to verify:
• For :
(Matches the graph point (0, 0))
• For :
(Matches the graph points (-1, -1) and (1, -1))
• For :
(Matches the graph points (-2, 0) and (2, 0))
• For :
(Matches the graph points (-3, 1) and (3, 1))
Understanding via Graph Transformations:
1. Start with the standard absolute value function:
This is a standard V-shape with a vertex at .
2. Shift the graph down by 1 unit:
The vertex moves down to , and the x-intercepts are at and .
3. Take the absolute value of the entire function:
This reflects any negative y-values (the section between and where the vertex was at ) over the x-axis, changing the vertex to and creating a W-shaped graph.
4. Shift the W-shaped graph down by 1 unit:
This shifts the entire W-shape downwards, moving the corner points to , , and , which corresponds exactly to the given plot.
Access expert-curated educational resources and study materials—completely free.
Create, conduct, and manage professional online assessments with Mindyard. Perfect for teachers and institutes.
Copyright © 2026 Mindyard. All Rights Reserved.




