
Year-wise variation of the price of a certain commodity is shown in the following graph:
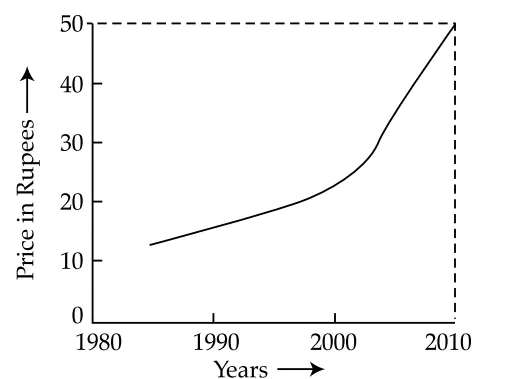
The price of the commodity in the year 1990
Correct Answer :
must have been anywhere between ₹ 10/- and ₹ 20/-
Solution :
The correct option is: must have been anywhere between ₹ 10/- and ₹ 20/-.
By analyzing the provided graph, we can observe the following details from the axes and labels:
1. Vertical Axis (Y-axis): Represents the Price in Rupees and is marked with values starting from 0 up to 50 in increments of 10 (specifically, 0, 10, 20, 30, 40, and 50).
2. Horizontal Axis (X-axis): Represents the Years and is marked with labels at intervals of 10 years (specifically, 1980, 1990, 2000, and 2010).
To determine the price of the commodity in the year 1990:
- Locate the year 1990 on the horizontal axis.
- Trace vertically upwards from the 1990 mark to the curve.
- From that point on the curve, trace horizontally to the vertical axis to find the corresponding price.
Observing the intersection on the graph, the curve at the year 1990 lies above the horizontal line for ₹ 10/- and below the line for ₹ 20/-. Mathematically, this can be expressed as:
where represents the price of the commodity in the year 1990.
Since the graph lacks a detailed grid to pinpoint the exact value, we cannot definitively say the price is exactly ₹ 12/- or any other specific value. Thus, we can only conclude that the price must have been anywhere between ₹ 10/- and ₹ 20/-.
Access expert-curated educational resources and study materials—completely free.
Create, conduct, and manage professional online assessments with Mindyard. Perfect for teachers and institutes.
Copyright © 2026 Mindyard. All Rights Reserved.




