
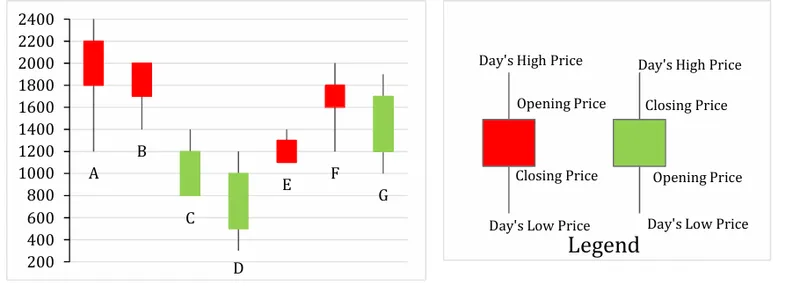
Directions (Q.25-Q.28): The chart below shows the price data for seven shares – A, B, C, D, E, F, and G as a candlestick plot for a particular day. The vertical axis shows the price of the share in rupees. A share whose closing price (price at the end of the day) is more than its opening price (price at the start of the day) is called a bullish share; otherwise, it is called a bearish share. All bullish and bearish shares are shown in green and red colour respectively.
Daily loss for a share is defined as (Opening price – Closing price) / (Opening price). Which among the shares A, B, F and G had the highest daily loss on that day?
Correct Answer :
A
Solution :
The correct option is A.
To find which share has the highest daily loss on that day, we first look at the Legend and the rules for reading the candlestick plot:
1. Bearish shares (red color): The price decreased over the day. The top of the solid rectangular body represents the Opening Price, and the bottom of the solid body represents the Closing Price.
2. Bullish shares (green color): The price increased over the day. The bottom of the solid rectangular body represents the Opening Price, and the top of the solid body represents the Closing Price.
3. Daily Loss formula:
Now, let us extract the values from the chart for shares A, B, F, and G:
1. Share A (Red / Bearish):
• Opening Price (top of the red box) = 2200
• Closing Price (bottom of the red box) = 1800
• Daily Loss calculation:
2. Share B (Red / Bearish):
• Opening Price (top of the red box) = 2000
• Closing Price (bottom of the red box) = 1700
• Daily Loss calculation:
3. Share F (Red / Bearish):
• Opening Price (top of the red box) = 1800
• Closing Price (bottom of the red box) = 1600
• Daily Loss calculation:
4. Share G (Green / Bullish):
• Opening Price (bottom of the green box) = 1200
• Closing Price (top of the green box) = 1700
Since the closing price is higher than the opening price, Share G recorded a net gain (negative loss value of approximately -41.67%).
Comparing the daily losses of the bearish shares:
• Share A: 18.18%
• Share B: 15.00%
• Share F: 11.11%
Thus, Share A had the highest daily loss on that day.
Access expert-curated educational resources and study materials—completely free.
Create, conduct, and manage professional online assessments with Mindyard. Perfect for teachers and institutes.
Copyright © 2026 Mindyard. All Rights Reserved.




