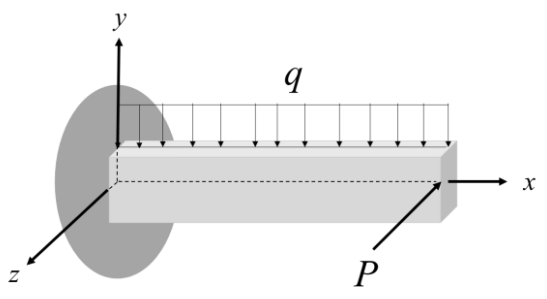
A beam of length 𝐿 is loaded in the 𝑥𝑦 −plane by a uniformly distributed load, and by a concentrated tip load parallel to the 𝑧 −axis, as shown in the figure. The resulting bending moment distributions about the 𝑦 and the 𝑧 axes are denoted by 𝑀𝑦 and 𝑀𝑧 , respectively.
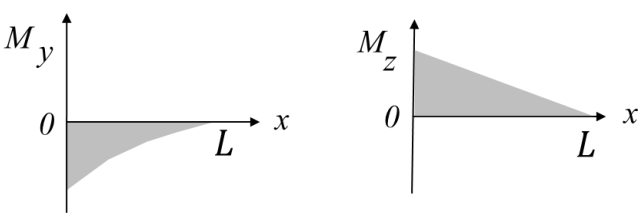
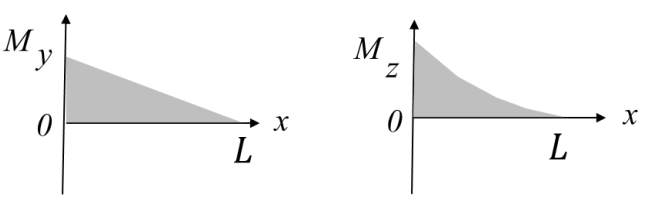
Which one of the options given depicts qualitatively CORRECT variations of 𝑀𝑦 and 𝑀𝑧 along the length of the beam?
Options
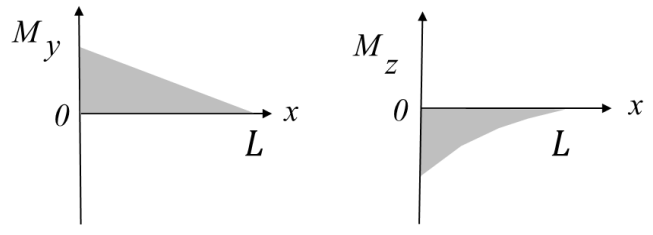
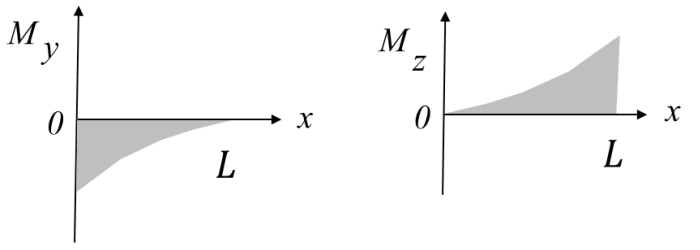
Correct Answer :
Solution :
The correct option is the one depicting a linear variation for My (which is positive) and a parabolic (quadratic) variation for Mz (which is negative) along the length of the beam.
Here is the detailed step-by-step logical and mathematical derivation:
1. Analysis of the Bending Moment Mz (caused by load in the xy-plane):
The beam is loaded in the xy-plane by a uniformly distributed load of intensity q acting downwards (in the -y direction) as shown in the main diagram (Image 0).
Let x be the distance measured from the fixed end at the left support (x = 0) to the free end (x = L).
The relation between the distributed load wy(x) and the bending moment Mz(x) is given by:
Integrating once with respect to x gives the shear force Vy(x):
At the free end (x = L), the shear force is zero (Vy(L) = 0), which yields:
Integrating a second time to find the bending moment Mz(x):
This shows that:
• The bending moment Mz(x) varies quadratically (parabolically) along the length of the beam.
• At the free end (x = L), Mz(L) = 0.
• At the fixed support (x = 0), Mz(0) = -qL2/2, which is negative due to hogging.
Therefore, the plot of Mz is a parabolic curve starting at a negative value at the fixed end and ending at zero at the free end.
2. Analysis of the Bending Moment My (caused by concentrated tip load P parallel to the z-axis):
The concentrated load P acts at the free tip of the beam (x = L) parallel to the z-axis (pointing in the -z direction).
At any cross-section at a distance x from the support, the bending moment about the y-axis is due to the force P acting with a lever arm of (L - x):
This shows that:
• The bending moment My(x) varies linearly along the length of the beam.
• At the free end (x = L), My(L) = 0.
• At the fixed support (x = 0), My(0) = PL, which is positive.
Therefore, the plot of My is a straight line starting at a positive value at the fixed end and decreasing to zero at the free end.
Conclusion:
Comparing these derivations with the options, the graph showing a positive linear variation for My and a negative parabolic variation for Mz represents the qualitatively correct bending moment diagrams.
Access expert-curated educational resources and study materials—completely free.
Create, conduct, and manage professional online assessments with Mindyard. Perfect for teachers and institutes.
Copyright © 2026 Mindyard. All Rights Reserved.